Inventory of Sources of Dioxin in some Nations
Here are data in Inventory of Sources of Dioxins in some Nations.
Table 1 Inventory of Sources of Dioxins (PCDDs/PCDFs) in Japan (air) [1].
|
Sources |
Central estimate (g TEQ/year) |
|
|
1997 |
1998 |
|
|
Non-industrial waste incineration |
4,320 |
1,340 |
|
Industrial waste incineration |
1,300 |
960 |
|
Unregulated small waste incineration |
325- 345 |
325- 345 |
|
Crematoria |
1.8- 3.8 |
1.8- 3.8 |
|
Steel Man.: Electric Arc Furnaces |
187 |
114.7 |
|
Steel Foundries EAF |
118.8 |
100.2 |
|
Zinc resumption |
34.0 |
16.4 |
|
Secondary aluminum smelting |
15.7 |
14.3 |
|
Other Industries |
26 |
26 |
|
Cigarette combustion |
0.075- 13.2 |
0.079- 13.9 |
|
Vehicle fuel combustion |
2.14 |
2.14 |
|
Ultimate disposal site |
0.078(water) |
0.078(water) |
|
Total |
6,330- 6,370 |
2,900- 2,940 |
Table 2 Inventory of Sources of Dioxins (PCDDs/PCDFs) in the United States (Air) [2].
|
Sources |
Central estimate (g TEQ/year) |
|
|
1995 |
1987 |
|
|
Municipal waste incineration |
1,100 |
7915 |
|
Hazardous waste incineration |
5.7 |
5.0 |
|
Boilers/industrial furnaces |
0.38 |
0.77 |
|
Medical waste incineration |
477 |
2470 |
|
Crematoria |
0.24 |
0.16 |
|
Sewage sludge incineration |
6.0 |
6.0 |
|
Vehicle fuel combustion - leaded |
0.0 |
32.4 |
|
Vehicle fuel combustion - unleaded |
6.3 |
3.8 |
|
Vehicle fuel combustion - diesel |
33.5 |
26.3 |
|
Wood combustion- residential |
62.8 |
89.6 |
|
Wood combustion - industrial |
29.1 |
27.5 |
|
Coal combustion |
72.8 |
62.6 |
|
Oil combustion - industrial/utility |
9.3 |
15.5 |
|
Cement kilns (hazardous waste burning) |
153 |
117 |
|
Cement kilns (non-hazardous waste burning) |
17.8 |
13.7 |
|
Cigarette combustion |
0.81 |
1.0 |
|
Kraft recovery boilers |
2.3 |
2.0 |
|
Forest, brush and straw fires |
208 |
170 |
|
Secondary aluminum smelting |
17 |
9.5 |
|
Secondary copper smelting |
541 |
304 |
|
Secondary lead smelters |
1.63 |
1.22 |
|
Total |
2,745 |
11,274 |
Table 3 Inventory of Sources of Dioxins (PCDDs/PCDFs) in Netherlands (Air)[3].
|
Sources |
Central estimate (g TEQ/year) |
||
|
1989 |
1991 |
2000 |
|
|
Municipal solid waste incineration |
697 |
382 |
3 |
|
Incineration of chemical waste |
43 |
16 |
0.1 |
|
Incineration of tip gas, biogas, sludge |
0.4 |
0.3 |
0.5 |
|
Incineration of hospital waste |
4 |
2.1 |
0 |
|
Incineration of waste oil |
2 |
2 |
2 |
|
Incineration of wood |
16 |
12 |
10 |
|
Cable burning |
6 |
1.5 |
0 |
|
Fires, flares |
9 |
9 |
9 |
|
Traffic |
7 |
5 |
2 |
|
Metal industry |
45 |
31 |
7 |
|
Application of pesticides |
50 |
42 |
20 |
|
Chemical processes |
5 |
3 |
3 |
|
Various processes |
15 |
10 |
8 |
|
TOTAL |
899 |
516 |
63 |
Table 4 Dioxins (PCDDs/PCDFs) Atmospheric Emissions in Canada [4].
|
Sources |
Central estimate (g TEQ/year) |
||
|
1990 |
1997 |
1999 |
|
|
Municipal Waste Incineration |
204 |
152 |
82.2 |
|
Wood Combustion (residential) |
35.7 |
35.7 |
35.7 |
|
Iron Manufacturing: Sintering Plants |
42.9 |
42.9 |
23.5 |
|
Pulp & Paper: Boilers Burning Salt Laden Wood |
10.5 |
10.5 |
10.5 |
|
Steel Man.: Electric Arc Furnaces |
9.1 |
10.2 |
10.2 |
|
Fuel Combustion Diesel (Traffic) |
8.7 |
8.7 |
8.7 |
|
Oil Combustion (residential) |
7.0 |
7.0 |
7.0 |
|
Electric Power Generation |
3.4 |
4.6 |
4.6 |
|
Wood waste combustion (saw mills & P&P mills) |
4.4 |
4.4 |
4.4 |
|
Cement Kilns |
2.6 |
2.8 |
2.8 |
|
Hospital Incinerators |
8.3 |
2.5 |
2.5 |
|
Chemical Production (air releases) |
2.2 |
2.0 |
0.3 |
|
In-service Utility Poles |
1.9 |
1.9 |
1.9 |
|
Wood Preserving Plants |
1.8 |
1.8 |
1.8 |
|
Hazardous Waste Incinerators |
2.1 |
1.3 |
0.8 |
|
Pulp & Paper: Kraft Liquour Boilers |
0.7 |
0.7 |
0.7 |
|
Federal Incinerators |
1.3 |
0.6 |
0.6 |
|
Steel Foundries EAF |
0.4 |
0.5 |
0.5 |
|
Sewage Sludge Incinerators |
0.3 |
0.3 |
0.3 |
|
Base Metals Smelting |
0.1 |
0.1 |
0.1 |
|
Secondary Lead Smelters |
0.1 |
0.1 |
0.1 |
|
Biomedical Waste Incineration |
4.9 |
0.0 |
0.0 |
|
Total |
353 |
290 |
199 |
1999* = projections
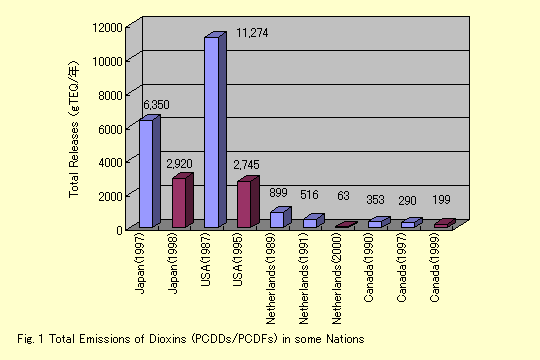
Here is a graph in comparison with these nations in regard to Total Emissions of Dioxins (Fig 1). [1][2][3][4]

According to Fig1, Japanese dioxin emission volume is highest in these industrial countries regardless of narrow national land. And, the waste incineration makes up the majority of emission of Dioxins. We will have to carry out 4R (Refuse, Reduce, Reuse, Recycle) more than ever.
November 16, 1999
Author: Kenichi Azuma
<Reference>
[1] "Conference for Dioxin Emission Reduction" Japan Environmental Agency, June 25. 1999
http://www.eic.or.jp/kisha/199906/59539.html
[2] EPA's National Center for Environmental
Inventory of Sources of Dioxin in the United
States” (EPA/600/P-98/002Aa, April 1998).
http://www.epa.gov/ncea/diox.htm
[3] Dutch Environmental Agency
[4] Canada Environmental Agency, January 1999
http://www.ec.gc.ca/dioxin/english/index.htm
"Dioxins and Furans Release Inventory
Report."